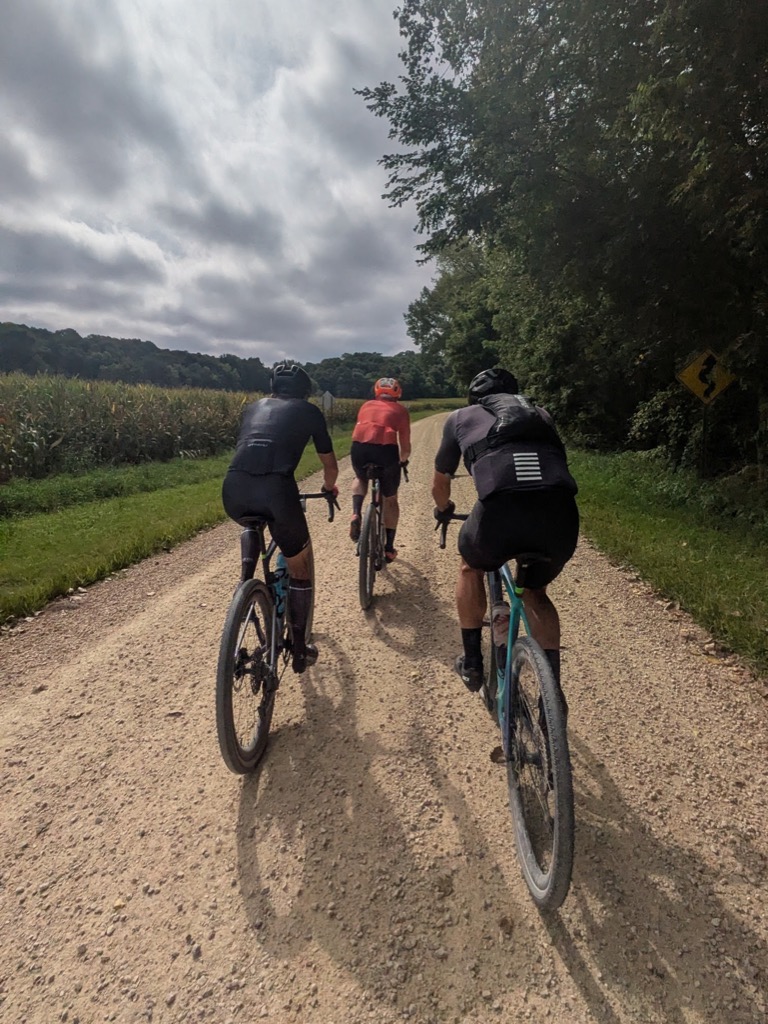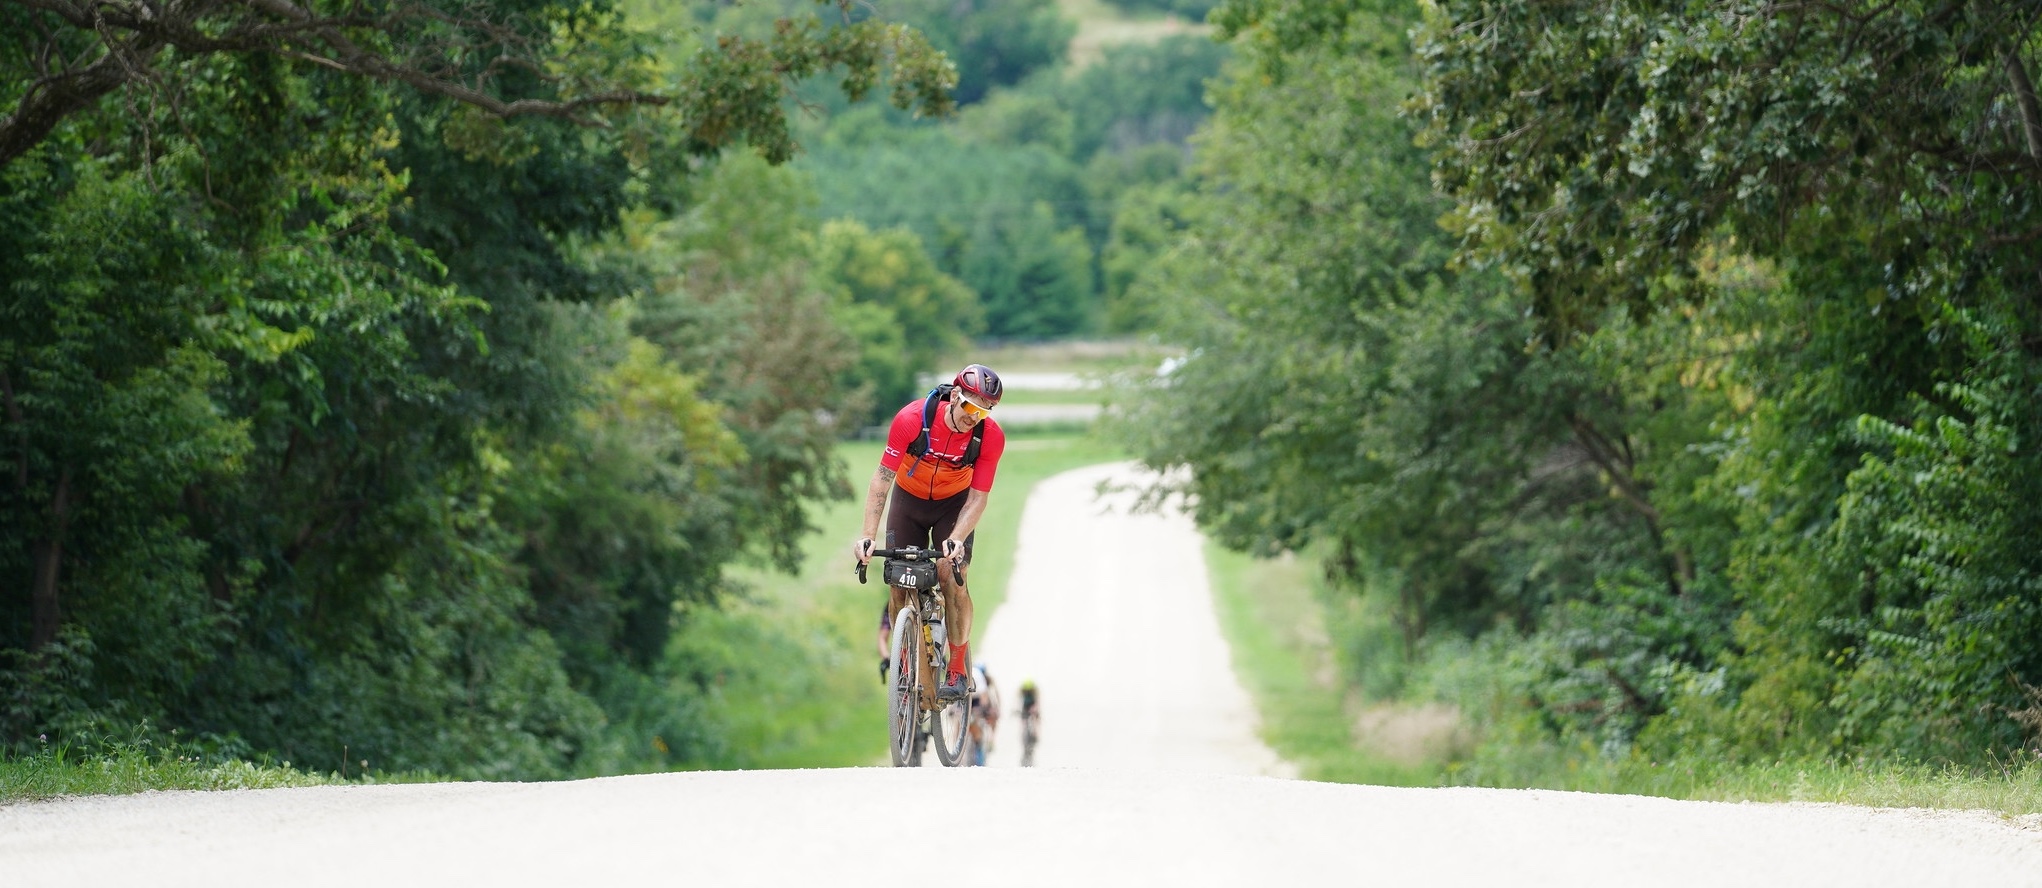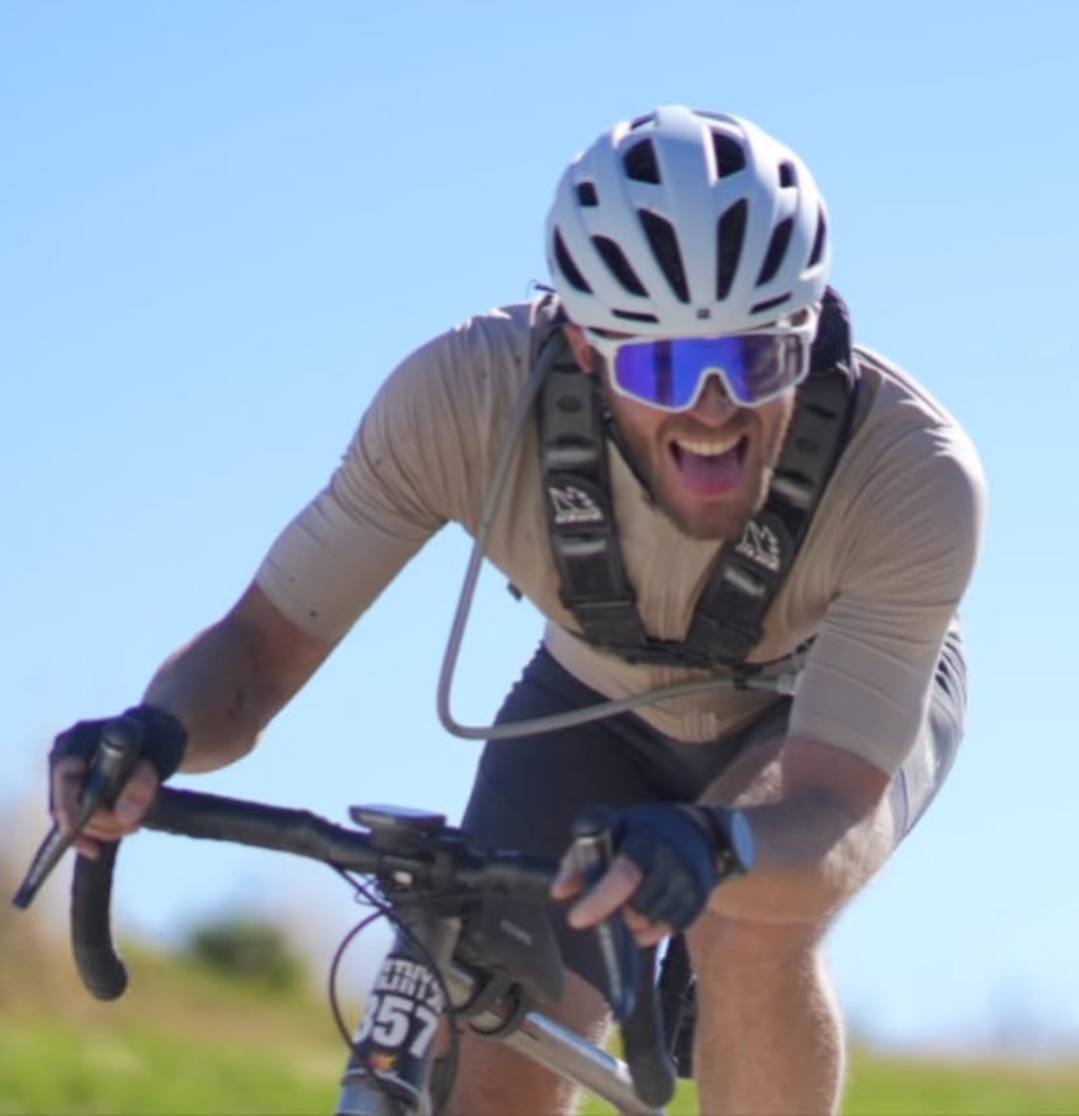
I’ve raced the Gray Duck Grit 50mi gravel race each of the last four years. It’s one of my favorite races around the Twin Cities and was the first gravel race I ever participated in back in 2023. Beautiful roads, challenging climbs in the heart of bluff country, and tough as nails competition where people push themselves hard but keep it a fun and friendly event. In 2023 I was very slow and didn’t have power data, but that changed in 2024.
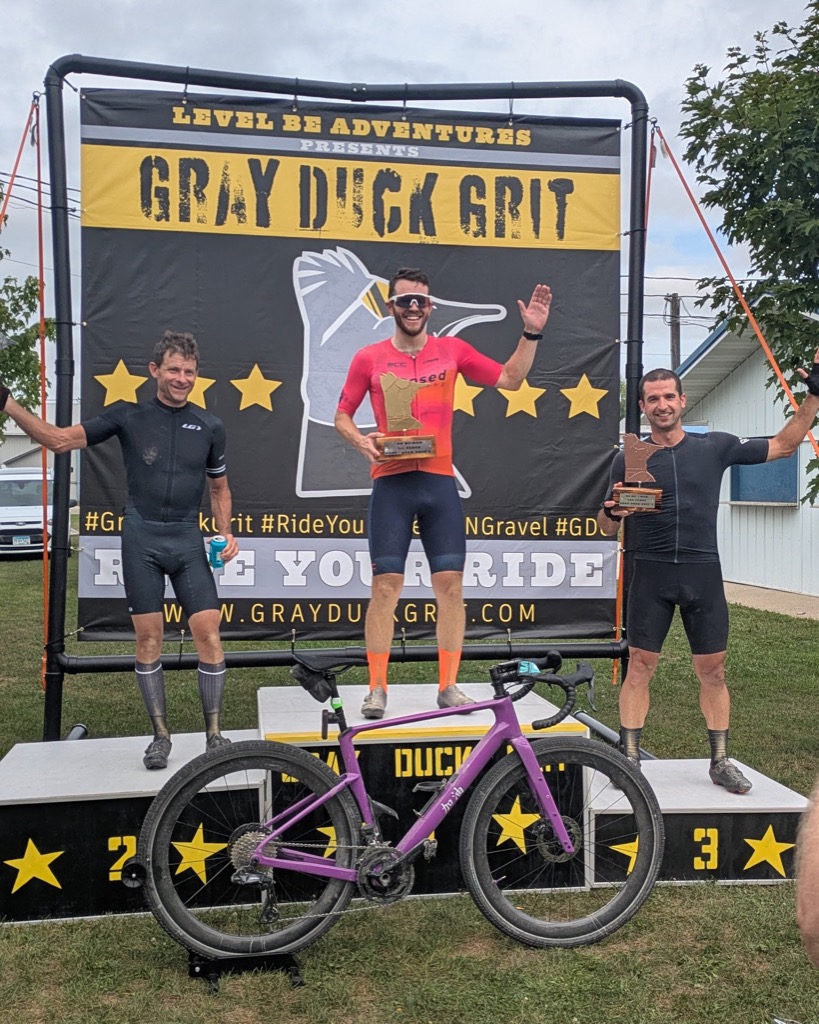
I won in 2024. Last year I got second and spent most of the race off the front with a youngster and also a strong climber named Chuck Smith. The youngster won last year in a sprint finish. He was locked in and earned his win! That race was fun and set the stage for this year. This year Chuck came back even stronger and as a climber, he knew he had to make all the climbs as hard as possible to win. Every climb and every kicker he attacked extremely hard, putting me (and third place finisher and friend, Matt Lyon) to the sword. I really thought at some point I’d get dropped but both Matt and I somehow managed to hang on. I eventually won with an attack right before the finish after the elevation had flattened out. Chuck is an incredible competitor and a fun guy to race with/against and this year’s Gray Duck Grit was a case in miniature about what’s so great about the gravel scene in the Twin Cities.
But all this fun got me thinking: every gravel race in the metro area has felt like it’s gotten much more competitive with each year. That I was in the front group of the Gray Duck Grit 3 years in a row gives a nice opportunity to test that hypothesis. Three years of power data on the same roads and many of the same climbs should be enough to determine whether the race has actually gotten harder, or whether it just feels that way in the heat of the moment.
This post is a bit of an homage to a great race with strong competitors. Chuck pushed me far past my limits and while he didn’t win this time, he was probably the strongest on the day. Next year I’m sure he’ll come back for revenge!
The aggregate numbers
First off, this year’s race definitely felt to me much harder than last year, but the usual aggregate numbers don’t reflect this. Normalized power came out to 298 W for me in both 2025 and 2026. My heart rate averaged 158 bpm last year and 159 this year. We did finish faster this year, but in principle that could be just due to differences in wind or road conditions or temperature (it was hotter, after all, and colder air is denser). But that’s not the end of it.
The climbs
That brings us to the climbs. The climbs this year were where I really felt the burn more than last year On the climbs I averaged 373 W this year against 355 W last year, and my time above 400 W on them went from 3 minutes to 7, but we can dive into more detail.
The course changes a bit from year to year, but four climbs are the exact same in 2025 and 2026. The total time spent on those four climbs was 93 seconds less this year. We did really climb faster.
But between the climbs we rode much easier and that’s what hid the difference. Harder where it counted, but easier everywhere else, and the averages happened to be the same both years.
It was 80 °F this year and 67 °F last year, which made it yet harder to hit higher power numbers in 2026.
Three years on the Sunset Trail climbs
The clearest view into the differences in difficulty from year to year comes from the two Sunset Trail climbs. They’re different hills a few miles apart that share a road name, and both have been on the course all three years. These are my numbers over the identical stretch of road each year. In 2025 and 2026 both, we formed an initial small group after the first sunset climb, then several riders who were dropped caught back on in between before being finally dropped on the second sunset trail climb.
Sunset Trail Climb: Mile 16, 1.03 mi, 206 ft
| year | time | average | best 5 s | best 15 s | best 30 s |
|---|---|---|---|---|---|
| 2024 | 4:22 | 332 W | 499 W | 398 W | 382 W |
| 2025 | 3:57 | 345 W | 619 W | 559 W | 532 W |
| 2026 | 3:36 | 375 W | 625 W | 579 W | 558 W |
Sunset Trail Climb: Mile 21, 0.75 mi, 189 ft
| year | time | average | best 5 s | best 15 s | best 30 s |
|---|---|---|---|---|---|
| 2024 | 3:43 | 309 W | 415 W | 363 W | 340 W |
| 2025 | 3:19 | 388 W | 618 W | 574 W | 514 W |
| 2026 | 2:57 | 416 W | 617 W | 558 W | 518 W |
Faster every year, on both, and 46 seconds faster than 2024 on each.
The peaks say more than the averages. In 2024 I rode these climbs at a steady tempo because I sent a flyer ahead of the climb so I could ride it at my own pace, knowing I’d likely get dropped, and my hardest 30 seconds on the mile 16 climb was only 50 W above my average for the whole climb. This year that gap was 183 W. The best 5 seconds jumped from 499 W to 619 W between 2024 and 2025 and has stayed there, so the attacking arrived in 2025. What’s kept changing since is how long anyone can hold that kind of power: my best 30 seconds on the mile 16 climb went from 382 W to 532 W to 558 W.
That’s what a more competitive race looks like in the data. Not just faster, but ridden in surges instead of at a tempo. The one at mile 16 is where this year’s race really came apart. Eight people went faster up it than the previous KOM time.
The long gradual climb at mile 8 tells the opposite story. I rode it in 6:07 in 2024 and 5:54 this year, 13 seconds apart over more than a mile and a half. The race wasn’t harder everywhere. It was just harder on the climbs where attacking actually works.
Replaying the climbs in 3-D
I built a 3-D replay enging that puts the years on the same road at the same time, each rider starting together at the foot of the climb. The road is colored by gradient, power reads out live above each rider, and the hard surges and best minutes are marked where they happened.
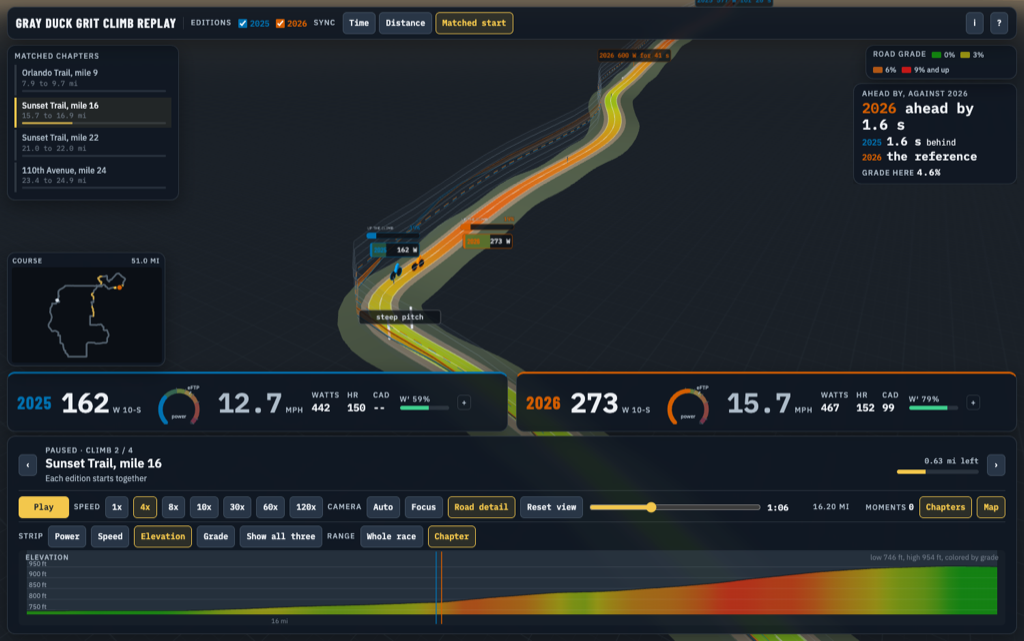
You can watch the climbs replayed yourself. The mile 16 Sunset Trail climb is the second chapter.
The report
A full, detailed comparison is in a report on the two years. It goes into much more detail climb by climb: power and time on each one, how much of my anaerobic capacity each climb used, where the surges happened, pacing by race half, heart rate, and even how I slept the night before.
Your own rides
I also built a tool called reclimb that allows you to view your own races on the 3-D climb visualizer. Drop in a .fit, .gpx, or .tcx file and it finds the climbs and replays them. Drop in two or three editions of the same race and it puts them on one road together, the way the Gray Duck Grit replay does. It all runs in your browser, so your files never get uploaded anywhere (we don’t believe in harvesting your data here at Goosed Cycling).
Next year